
Climate adaptation
Global severe weather risks grow
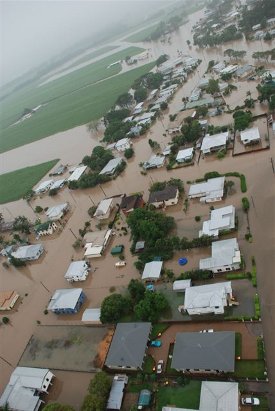
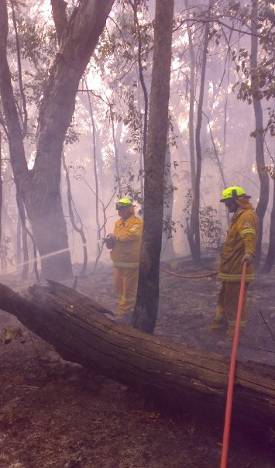
According to the Bureau of Meteorology, '2009 will be remembered for extreme bushfires, dust-storms, lingering rainfall deficiencies, areas of flooding and record-breaking heatwaves.'
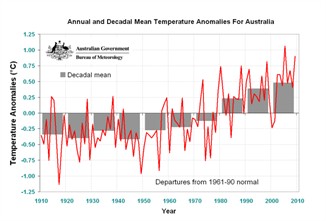
BOM data reveals that Australia's 2009 mean temperature was 0.90°C above the 1961-90 average.
2009 was the nation's second warmest year since high-quality records began in 1910.
Victoria, South Australia and NSW all recorded their warmest July-December periods on record.
BOM states that, 'extreme heatwaves occurred across much of southern Australia during late January/early February resulting in a new Melbourne maximum temperature record of 46.4°C, new State maximum temperature records for Victoria (48.8°C at Hopetoun) and Tasmania (42.2°C at Scamander), and contributing to the Black Saturday bushfires.'
Variability is part of the trend
Natural variability is a feature of Australian weather records over time. 2007 was a La Nina event instead of El Nino, which helps to explain why 2008 was cooler on average across Australia than other recent years.
Thermal inertia: Key risk factor
There is a time delay between when concentrations of CO2 particles in the atmosphere increase causing atmospheric temperature rise, and when ocean temperatures rise.
In other words, there's a time lag between when the Earth begins to experience an energy imbalance and when the climate fully responds to it.
This: "thermal inertia" factor is the central risk factor in assessing severe weather trends. Here's what Nathan Lewis from CalTech University, in interview with ABC Radio National, has to say about this risk:
|
"You see the Earth has a 35 year thermal inertia and so what we're doing now is only the beginning because we're waiting 35 years even to see the effects of what we did 35 years ago. So it would be another 30 years until we started to really see, even at the only 380 parts per million level [of C02-e atmospheric concentration] that we're doing now, what those effects are.
And we'll be at 550 [parts per million of C02-e contentration] by then - or more - and it's never been above 300. So there's a serious debate over whether that will be very bad or not, very bad, but all we know is no matter what we do when we get there there's no turning back."
Dr. Nathan Lewis, Professor of Chemistry, California Institute of Technology |
Insurance evidence of escalating climate change impacts
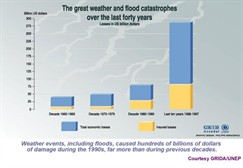
Although the evidence is sparse and difficult to compare given changing data gathering techniques, scientists are closely assessing the risk that weather related natural disasters are climbing in line with a warming planet.
The past 19 out of 20 major Australian insurance events were weather related, and this increase reflects European insurance findings.
The graph below developed by Munich Re, the world's largest
re-insurance group, highlights the significant increase in economic
and insurance losses (the dollar cost of damage done and the
portion of this cost that was insured) when we compare great
weather related disasters during the 1990s compared to previous
decades.
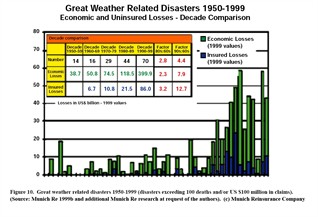
Some portion of this dollar comparison arguably is due to reasons other than climate change such as growing capital investment, population and migration to areas where disasters hit.
But climate change must feature strongly in the explanation if we observe the sheer number of significant events: 70 during the 1990s compared to 44 in the 1980s and 29 in the 1970s.
|
|
Increasing extreme weather evidence
|
|
|
Trends in number of reported events
This supports the overall extreme weather trends highlighted in IPCC evidence provided by the Centre for Research on the Epidemiology of Disasters (CRED) which is shown in this graph.
|
|
|
Rising Sea Levels
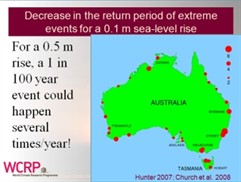
The potential for extreme weather events to occur much more frequently is linked to the evidence of rising sea levels. In 2001, the IPCC predicted an annual rise of less than 2mm in the next decade. In 2007, the IPCC reported that between 1993 and 2006, sea levels actually rose by 3.3mm a year. An annual rise of 3.3mm is right at the upper limit of the IPCC's predictions. Most scientists specialising in this area believe we will experience more at least a one metre rise in sea levels by the end of the century. This means that one-in-one-hundred-year-events could happen much more frequently in vulnerable areas highlighted.
|
 |
Human induced climate change & hurricane activity
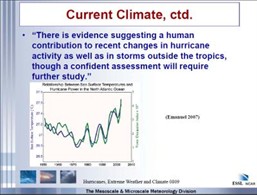
According to Greg Holland from the US National Centre for Atmospheric research in a 2009 presentation, 'it is likely that the annual numbers of tropical storms, hurricanes, and major hurricanes in the North Atlantic have increased over the past 100 years, a time in which Atlantic sea surface temperatures also increased.'
|
More information...
- Climate adaptation and the built environment
- Come Witness King Tides!
- Sea levels rising faster than expected
- World Bank Development Marketplace
- Climate change refugees – the human impact
- Climate change adaptation in the Torres Strait
- Remembering rights to land and culture in discussions of ‘climate refugees’
Copyright © Green Cross Australia | Terms & Conditions | Privacy Policy
web design brisbane :: (zero)seven

![trends_in_natural_disasters_004[1]](/media/9555456/trends_in_natural_disasters_004[1]_243x220.jpg)
